
Hello, to my understanding when trying to export a hazard map you choose a probability of excedance in a time frrame (e.g. 50 years). What is the purpose of choosing a mean return period at global parameters when this is indirectly given to the program with a probability of exceedance in a given timeframe while expoting the results?
Searching: exceed probability - 13 Results Found

CRISIS Creation of an attenuation table
Content_Manager
posted this
27 May 2019
Dear Nikos,
Up to now, R-CRISIS supports three probability distributions that can be used to describe intensities. These distributions are presented in the following table, along with the two statistical moments that have to be given in order to correctly describe A|M,R as a random variable:
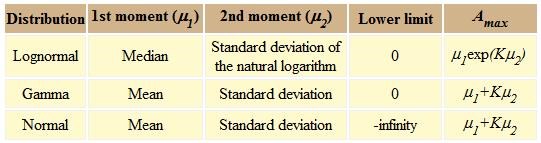
To truncate the PDF of the GMPE to 1 sigma, the correct value of Amax (in the attenuation table file) would be -1.0. In this way, the integration will be performed between the lower limit of A and Amax, where Amax is defined as follows:

For more information about truncation of GMPEs, you may look for "Probabilistic interpretation of attenuation relations" in the R-CRISIS Help Menu.
Thank you for your preference and interest in R-CRISIS.
Best regards,

- Liked by
-

