Program for computing seismic hazard

Creation of an attenuation table

Creation of an attenuation table

  • 781 Views
  • Last Post 07 June 2019
Marisella Ortega posted this 22 May 2019

 I want to use an attenuation law that we created with Chilean data to calculate the seismic hazard. The equation is the following for interplate data:

image.png

We have to create the table the way the manual explains in .atn format. The first part of the table would be as follows:   4.0 8.9 11 5 500 20 2 0 2E-01 0 0   And then would come the accelerations in g with the law we have, however, I don't know how they should be logarithmically spaced as described on page 39 of the R-CRISIS 2018 manual. To what do the K and NMAG parameters of equations Eq. (2-31), Eq. (2-32), Eq. (2-33) and Eq. (2-34) correspond?   image.png  

Could you help me to understand how to create the table with the correct values logarithmically equi-spaced?   Thank you for your help, Marisella.

Order By: Standard | Newest | Votes
Content_Manager posted this 22 May 2019

Dear Marisella,

Next, you may find a step-by-step process you should follow to build the attenuation table corresponding to your model:


1. Calculate DMAG and DLRAD using equations 2-41 and 2-43:


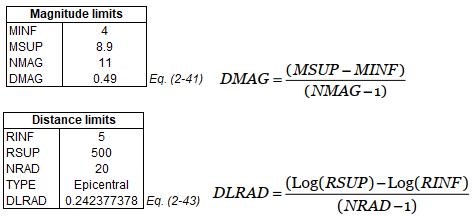
2. Define the k's bins for magnitude and distance: according to your information, there are 11 and 20 bins for magnitude and distance, respectively. Using equation 2-40 (for magnitude) and 2-42, (for distance), their bins can be determined. In both equations, k refers to the bin you are defining; for instance, in your model, k_magnitude is from 1 to 11, and k_distance is from 1 to 20. Since your model depends of distance (R), not log(R), you have to apply the antilog (exponential) to the distance bins previously determined. Note that for k=1, the magnitude and distance bins correspond to the lower limit of magnitude and distance, respectively, likewise, for k=11 (magnitude) and k=20 (magnitude) the bins correspond to the upper limit of magnitude and distance, respectively.


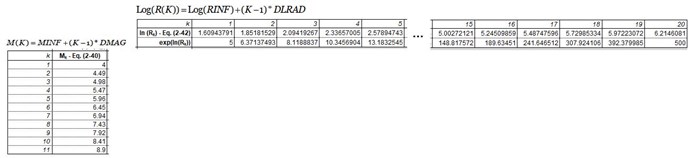
3. Calculate the intensity for each magnitude-distance pair using the equation of your model:


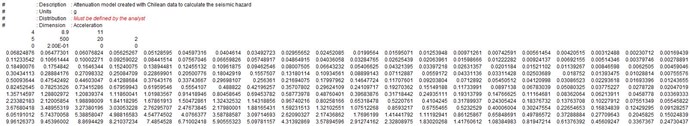
4. Repeat step 3 for each spectral period. If your model was defined only for PGA, the attenuation table is done.


5. Copy results to a text file and make sure they do not have funny characters between them. Remember to save the file with extension .atn


I hope this helps you to build your attenuation table.

If this attenuation model is published in any report/article, please share with us its reference and maybe in further versions it will be included as an built-in model.

Do not hesitate to contact us if you have other questions about this subject.


Thank you for your preference and interest in R-CRISIS.


Best regards,

Nikos Vavlas posted this 25 May 2019

Hello, if i want to trancuate the PDF of the GMPE lets say to 1 sigma, what parameter should i set to Amax?

Content_Manager posted this 27 May 2019

Dear Nikos,

Up to now, R-CRISIS supports three probability distributions that can be used to describe intensities. These distributions are presented in the following table, along with the two statistical moments that have to be given in order to correctly describe A|M,R as a random variable:

To truncate the PDF of the GMPE to 1 sigma, the correct value of Amax (in the attenuation table file) would be -1.0. In this way, the integration will be performed between the lower limit of A and Amax, where Amax is defined as follows:

For more information about truncation of GMPEs, you may look for "Probabilistic interpretation of attenuation relations" in the R-CRISIS Help Menu.


Thank you for your preference and interest in R-CRISIS.


Best regards,


  • Liked by
  • Nikos Vavlas
Nikos Vavlas posted this 07 June 2019

Thank you very much.

  • Liked by
  • Content_Manager
Close