Content_Manager
posted this
08 October 2018
- Last edited 08 October 2018
Dear Paul,
In the R-CRISIS Help Menu is explained, in detail, how to build a attenuation table (R-CRISIS Help Menu -> Ground-motion prediction models -> Attenuation tables). However, I am attaching an example to show you how the structure of this file is.
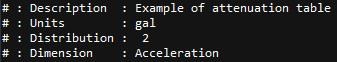
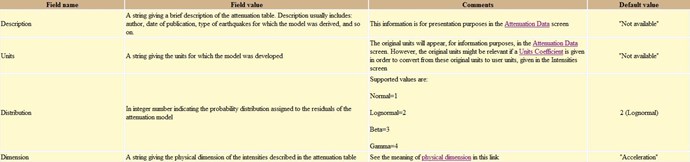
The meaning of each row is the following (taken from R-CRISIS Help Menu):
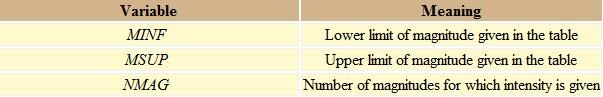
- Parameters defining the magnitude and distance limits and type:
Magnitude:

MINF, MSUP, NMAG
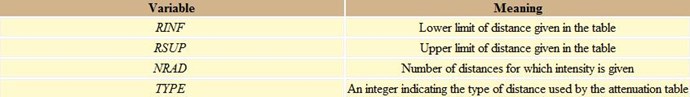
Distance:

RINF, RSUP, NRAD, TYPE
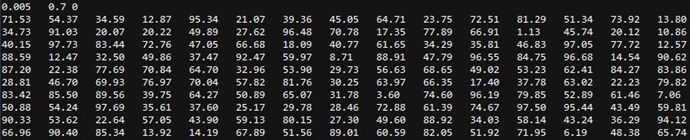
Intensities for structural period equals to 0.005s, sigma=0.7, Amax=0 (no truncation), CoefH=0.
Each row represents a magnitude and each column represents a distance.
Likewise, a similar intensities block is built to T=0.15s:
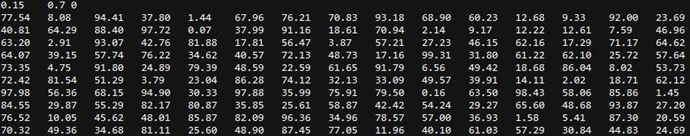
Intensities here presented are not real, they are random numbers only to show the structure of the file.
As can you see, in the attenuation table only magnitude and distance vary for each row and column, respectively. This means that soil and focal mechanism type are constant for all intensities here presented.
In the following link, you will find an example of Attenuation Table loadable in R-CRISIS. Keep in mind that intensities contained in this file are not real, they are random values.
Example of Attenuation Table
Thank you for your preference and interest in R-CRISIS.
Best regards,