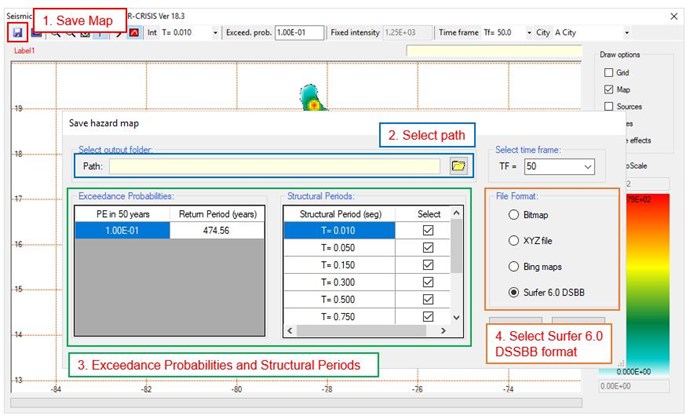
Seismic Hazard results are shown in Hazard -> See Hazard Maps menu. There, you can export such Hazard Maps in different formats: Bitmap, XYZ file, Bing Maps or Surfer 6.0 DSBB. To export a map to a GIS application format, you have to follow these instructions once you are inside Hazard -> See Hazard Maps menu:
1. Click on Save Map icon
2. Select path where you want to save yours maps
3. Select Exceedance Probabilities and Structural Periods which you want to export. You may add additional Return Periods by Right Click -> Insert Row while standing inside Exceedance Probabilities table zone
4. Select Surfer 6.0 DSBB Format
5. Click OK
Your maps will be saved within path you selected and will be able to be loaded in any GIS software, such QGIS.