Dear Rahma,
This article was directly taken from the R-CRISIS Help Menu.
I hope it solves your questions.
Magnitude-Distance disaggregation results
CRISIS can generate exceedance rates disaggregated by magnitude, distance and "epsilon" value. The program presents these values graphically, in the disaggregation screen.
To see disaggregation results in this screen the following operations are needed:
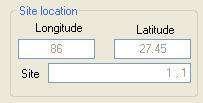
Select the site for which results are desired by pointing to it with the mouse in the right-hand side picture box, which shows either the computation grid or the list of sites. The actual point used for the disaggregation computations will be the one belonging to the grid or list of computation sites that is the closest to the point clicked by the user. The actual point used for disaggregation will be indicated in the "Site Location" frame:
![]()
![]()
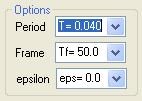
Choose the desired intensity measure (usually, a spectral ordinate associated to a structural period), time frame and epsilon value in the "Options" frame:
![]()
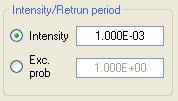
Choose, in the "Intensity/Return period" frame, the value of intensity for which disaggregation results will be presented or choose the desired exceedance probability (CRISIS will compute exceedance probability if intensity is given or intensity if exceedance probability is given):
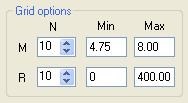
Use the "Grid options" frame to define the size of the disaggregation chart, giving the limits for magnitude and distance, as well as the number of cells in each direction:
![]()
In general, disaggregation charts will be redrawn every time a parameter change is made.
Results will be shown in a disaggregation chart like the following:
![]()
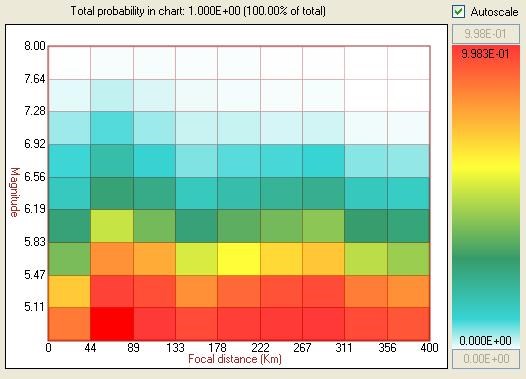
The value in each cell is the probability that the selected intensity level is exceeded in a given time frame if only earthquakes with magnitudes and distance within the cell's range are accounted for. The color scale will adjust automatically if "Autoscale" is selected. The user, however, can change the upper (red color) and lower (white color) limits of the scale, once the "Autoscale" option is disactivated.
On top of the disaggregation chart, CRISIS shows the following legend:
"Total probability in chart: 0.000E+00 (100.00% of total)"
This legend indicates that, with the current grid settings (magnitude and distance limits) and the selected "epsilon" level, the total probability of exceedance is a certain percentage of the total exceedance probability (for all magnitudes and distances, and epsilon equal to minus infinity).
However, the total probability is computed by interpolation of a previously computed hazard curve for the site. If computation of this hazard curve was made for a small number of intensity levels, the interpolation will not be exact, and percentages reported by the legend could be somehow inexact. To solve this problem, simply compute the hazard curves with a larger number of intensity levels.
When seeing CRISIS disaggregation results, the user must not expect that the exceedance probabilities associated to each cell used for the disaggregation add up to the total exceedance probability computed for the same site, intensity value and time frame. As shown in this link, arithmetic of exceedance probabilities is more complex to that of intensity exceedance rates used in conventional hazard studies.
Disaggregation charts can be saved using button “Save”, which will save in a text file the currently displayed chart settings, as well as the matrix of disaggregated hazard values.
Thank you for your interest in R-CRISIS.
Best regards,