
How to understand deaggregation output in r-crisis? and what does "total probability In the chart" mean? why the value not 100% ?
I really appreciate your answer, sir
Thank you
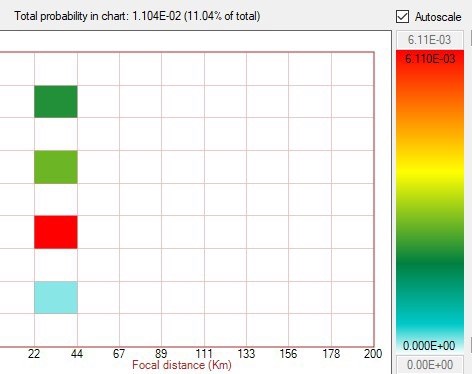
How to understand deaggregation output in r-crisis? and what does "total probability In the chart" mean? why the value not 100% ?
I really appreciate your answer, sir
Thank you
Dear Arka,
To switch between different return period results, you have to specify the exceedance probability in the text box:

In this way, you will be able to obtain seismic hazard results for more return periods than you specified before running your model.
Remember that the exceedance probability is given by:

Where,
Te is the time frame
Tr is the return period
For example, an exceedance probability equals to 10% corresponds to a 50 years time frame and 475 years return period.
Thank you for your interest in R-CRISIS.
Best regards,


